Clair Obscur: Expedition 33

A screenshot of a rendered Paris-inspired landscape, with the Eiffel Tower's top twisted towards the right and dark rocks floating in the sky
Source: media from Expedition 33 website

Today, I finished Clair Obscur: Expedition 33. Before I give a link to the game website, I need to say that I’ve been advised to get into the game without knowing anything about it, and that it was good advice. That said, at the risk of spoilers: Clair Obscur: Expedition 33.

The game has been recommended to me by at least two people who do not know each other, with the same kind of recommendation: a/ it’s amazing you have to play it b/ don’t read anything about it before playing, just get in there and enjoy. I’ll try, in this post, to keep the potential spoilers to a bare minimum; that said, if you want the pristine experience, you may want to stop reading here, go play the game, and see where you go from there :p

Continue reading “Clair Obscur: Expedition 33”

Fun with maps

My AlphabeticalZürich project may not be very active when it comes to content, but it’s been an interesting source of tinkering lately. I’ve moved it out of WordPress to a statically-generated set of pages (that’s a story for another blog post, which I should write before I forget everything) and, in the past couple of days, I’ve added a progress map.

The idea of a progress map has been around since the early days of the project – I’m pretty sure Matthias was the one suggesting it in the first place, and it stayed in a corner of my brain. At the time, it felt somewhat overwhelming; I had explored stuff around the OpenStreetMap ecosystem, but had not dug that rabbit hole deep enough to get anywhere interesting.

And then, a few days ago, a few stars aligned in the form of “having a few days off”, seeing a Mastodon post about custom maps, remembering that the person in question DOES have custom maps on her website, digging around source code to see how that kind of things could possibly work, and finding the right resources at the right time.

First thing first: displaying map tiles

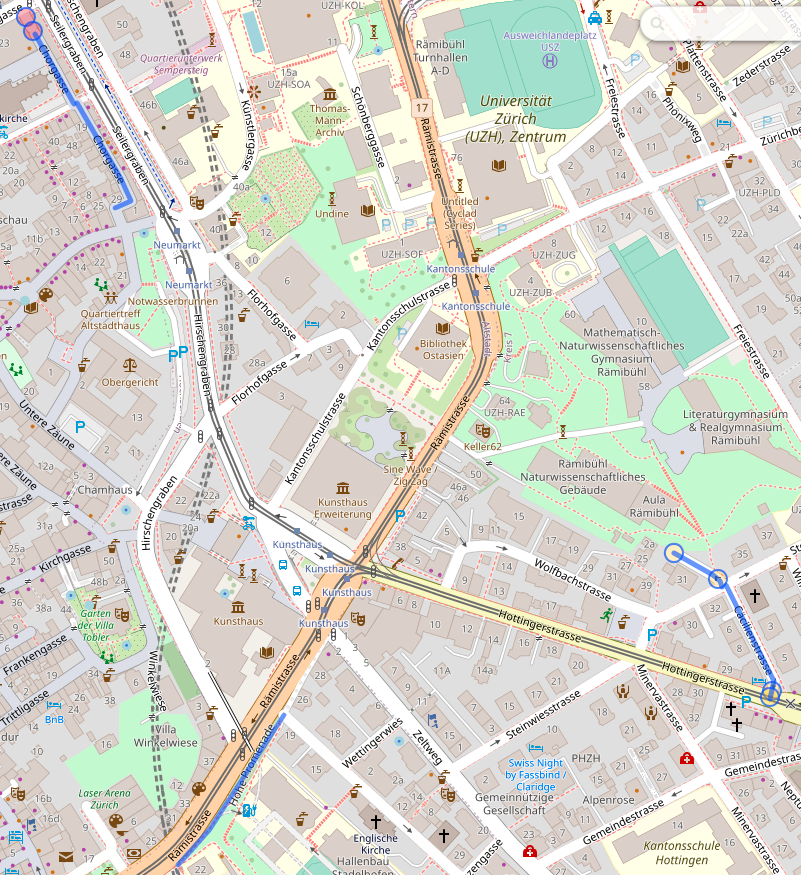
The data I want to display are lines representing streets of Zürich. And technically I could probably display a set of lines of different colors and be done with it, but a map is nicer with stuff like context and labels, so I needed a base map. The canonical way of displaying a map is to use tiles, so I knew this was one of the building bricks of my project.

The fact that I found Protomaps early in my “okay, how would I do this”-research was instrumental in the existence of this project, because the rest felt far more achievable on my own. Protomaps has a free tier that should be more than enough for the needs of my tiny website, and it looked easy enough to integrate. Its main feature is also to provide the tiles in a single file, so if I wanted to move that to my own storage, that’s a possibility. I went for the Leaflet integration because the doc promised me it was simple, and indeed it was.

Add centering coordinates, decide for a color scheme (I’m cheating, this came a bit later 🙂 ), and I have map tiles, which is one problem solved.

Adding progress data

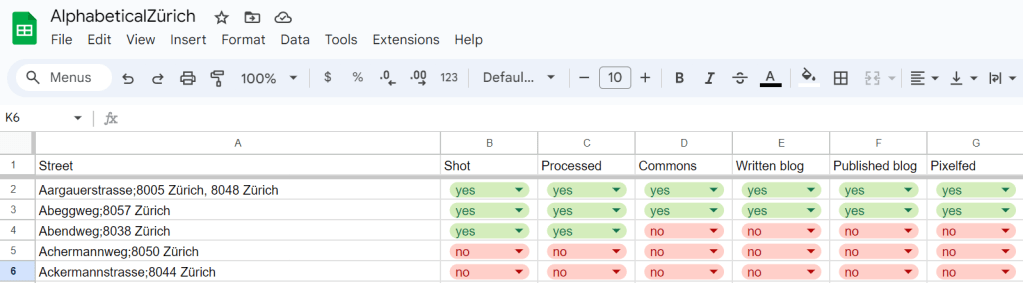
To my map tiles, I wanted to add colored lines for “streets that I have published”, “streets that I have visited but not yet published” and “streets that I have planned to visit next”. I have this information in a spreadsheet, so that’s easy enough to exploit; but to be able to add lines to the map, I needed coordinates. The one format I’m vaguely familiar with (because I have written some code for Kartographer, the map extension of MediaWiki) is GeoJSON, and Leaflet supports that, so GO, GO, GO! I first started playing with the idea of making my own geometries with geojson.io and promptly decided against it (“this is going to make my publication process more complicated, how about no”) and remembered that Zürich has a lot of open data, and in particular the Strassennamenverzeichnis (“street name directory”) that does have line geometries in there.

So I wrote a small script to merge my spreadsheet (exported to CSV) and the Zürich open data source into a custom GeoJSON, and added it as a layer to my map. As a first test, I copied the whole thing in geojson.io, and for the first time I had a map of “where did I go already”, which felt pretty good!

It required some tweaking to get it to work on Leaflet, because, as it turns out, while the geometry definition is well-specified by GeoJSON, there doesn’t seem to be a standard for their display. The styles are typically defined as properties stuffed along the geometry, and these properties do not have consistent naming or schema depending on the display software. Still, eventually, I did manage what I wanted, and so at that point I had, on my local machine, a map base enriched with progress information. Wonderful.

That said, I had colors, but no legend whatsoever, and a map without a legend isn’t very useful. Thankfully, Leaflet has a way to add a “control”, which can contain arbitrary DOM – so I added a small legend in a very ugly but hopefully still vaguely reasonable way. (I’ll need to fix that at some point.)

Interlude: limiting the access to the API

So I had all my stuff still on my local machine, and the goal was still to have that map somewhere on AlphabeticalZürich. And there came something that kind of bothered me: the access to Protomaps puts the API key in the URL, and provides a way to define CORS limitations (which are client-side, not server side – although in that case there is some validation on the server side too). I am reading this as “API keys are not secret”, and the usage policy made me believe that, if my key was used by someone else that would mess up with my free quota, I could recover from that, but I took it as a challenge to try to not leak that key. Turns out, it was a bad idea, as I realized when writing that post.

Additionally, I’m trying to be a good citizen, and to not hit my wonderful tiles API more than I should. In particular, if I can avoid accessing tiles from any other area than Zürich, it feels like a good idea.

Some reverse proxying fun (and learning some lessons)

Now for the “let’s avoid leaking the key” part. It was pretty obvious that anything client-side would leak, so my goal was to send requests to my own stuff, inject the key there, transfer the request and get the result back. That’s the job of a reverse proxy, so I played with my Apache config until it worked (and I didn’t mess up Apache restart once in the process, proud of myself there).

Now, obviously, I do have an open URL on my website (because client-side Javascript needs to be able to access it), which doesn’t have an API key, that gets transformed behind the scenes to an url with said API key. Which means that anything can use my public URL to hit the Protomaps API without a key. Somewhat counter-productive.

The following train of thought was to add a filtering on the HTTP referrer of the URL, which does work, but which is also trivial to bypass by injecting the same header. That kind of made the whole process useless overall, but it felt “well, not worse than having an API key on the page, because the potential abuse mechanism I can see also basically is “add a HTTP header and be happy”.

Except, it actually *is* worse, which I realized when writing this blog post and feeling uncomfortable writing this down. It is actually worse for two reasons:

  • All the requests in the reverse proxy abuse scenario are eventually made from *my* machine – I’m basically running an open proxy for which I’d be responsible to shut down bad traffic (oops)
  • More importantly: it makes “changing the API key in case something goes wrong” COMPLETELY useless (large oops).

So all in all, I was feeling very smart when I made Apache do what I wanted to do, and very stupid when I realized that what I wanted to do was utterly counterproductive and actually actively harmful. Lesson learnt: if your client is supposed to access the key, so be it, and don’t try to outsmart documentation to deal with imaginary dangers. And yes, I suppose I could have gone the route of making a proper back-end and running things server-side and be happy, but I really don’t want to have a back-end on this website. This thing is made to be integrated to a web page, this is the way.

I’m probably still going to want to avoid putting that key on a public git repository, because there’s a difference between “it’s in a JS somewhere on a low-traffic website” and “it’s on GitHub open to anyone searching for ‘key='”, but that’s a problem for future me, probably (and actually an easy enough problem, since I’m already adding menus to that page programmatically.)

Handling map boundaries

I still wanted to handle map boundaries correctly, because that just felt nicer. It was an interesting problem, because for a while I thought it just wasn’t working – but, in fact, it wasn’t working *as I expected*. What ended up working was a combination of three settings on Leaflet.

  • Setting maxBounds to “area around Zürich” – this is what I expected to need to do, so far, so good.
  • Setting maxBoundViscosity to 1 – that’s a setting on Leaflet that defines how much the maxBounds are actually enforced; by default it’s 0; 1 bounces the display back into the bounds if the user pans out of the map
  • Setting minZoom to 12 – that’s the thing that required me to think most. I was very confused at the beginning, because I could zoom out to the world and then zoom back in to any place in the world outside of maxBounds, and I wasn’t sure why – until I noticed that the maxBounds documentation was explicitly talking about panning. Hence, setting a minZoom to “some value that will allow to see the whole map but would not allow to zoom in to something wildly outside of the chosen bounds” seems to work decently enough. I was happy to have a tiny bit of a sense of how tiles are structured, because it made me connect a few dots in my head quicker than it would have otherwise.

Bells and whistles: Zürich city boundary

For the finishing touch, I also wanted to add the Zürich city boundary to the map. It was somewhat more annoying to get the correct data – I didn’t find it on the Zürich-city level (because everything I had was defining multiple areas, for which I would have needed to get the outer polygon – feasible, but annoying), and finally found it on the Zürich-canton level. Note to self, as it took me a while to find how to do this (and a while to find AGAIN how to do this): click on the “Datenbezug” download arrow, and then on the first question instead of “OGD Produkte” choose “WFS-Datenquelle”, and then the rest is relatively straightforward.

RELATIVELY, because there’s a final trap: the default coordinate system is in the Swiss coordinate system, and it took me a bit of time to understand why I wouldn’t get a polygon on my map. Once that was fixed, I fought a bit with the styling definition, but I finally got the map I wanted to have.

Conclusion

I’m happy that I started with “okay, how would I do this” and managed to get through the whole project, which was not that large, but on which I had given up previously, and that connected quite a few points and a couple of rabbit holes. I’ve learnt stuff and I have something to show for it, so all in all that was very satisfying 🙂

Now introducing: AlphabeticalZürich

I recently ran into a Mastodon post of someone who started photographing all the streets of Paris, in alphabetical order: MonParisAlphabétique. I thought that it was a GREAT idea, worth pursuing for other cities, and, since I live in Zürich, I recently started AlphabeticalZurich, which I’m hosting on WordPress and Pixelfed. So if you’re only interested in the pictures and the photography side of things, you can stop reading here and go there (WordPress) or there (Pixelfed; sorted by collections/streets here).

But, there’s a few gritty details that belong to this blog rather than the other one 😉 I prefer to start projects with a tiny bit of logistics, and in particular establishing the list of streets and how to traverse it sounded like a reasonable idea. Here comes the rambling blog post about what I tried, what I played with, and what’s the current status of said logistics.

To get the list of streets of Zürich, I turned to the Swiss OpenData data, and got a link to the CSV of all the streets of Switzerland on geo.admin.ch (other formats are available and documented in the metadata).

The lines look mostly like this:

10006621;Bahnhofstrasse;8001 Zürich;261;Zürich;ZH;Street;existing;true;12.08.2023;2683111;1247210

in which I’m interested in the second and third field. There’s a bit more subtlety, the third field is sometimes a multi-valued field separated by commas (when a street spans several zipcodes or even several cities).

Let’s clean this up a bit:

$ cut -d ";" -f 2,3 pure_str.csv | grep -E "8[0-9]{3} Zürich" | sort

The first few lines are kind of “meh” because they’re highways (and that sounds kind of dangerous), so let’s drop the A\d streets:

$ cut -d ";" -f 2,3 pure_str.csv | grep -E "8[0-9]{3} Zürich" | grep -v "^A[0-9]" | sort 

and we have a list. Now, that list contains 2425 entries, so I’m going to need to do a bit more than one street a week if I want to have a chance of finishing this. Since I know myself, I need to optimize “a bit, but not too much”. So if I’m in a street starting with A, and there’s another one in the vicinity, I may want to go shoot it while I’m at it, even if it’s technically not the next one on the list. My first idea was to use zip codes as a heuristic for “places that are in the same vicinity”. So the algorithm would look a bit like this:

pick the first non-photographed street on the alphabetical list
pick all the streets starting with the same letter in the same zipcode, in order
take pictures of all these streets, mark them as photographed

Okay, this starts to be too complicated for my one-liner Bash (I tried. I really did.), so let’s get some Python instead (I did wonder if I wanted to write some ugly PHP or some ugly Python, so you’re getting some ugly Python.) I also added a bit of output to get a query for overpass turbo.

f = open('zuri_sorted.txt', 'r' )
currLett = '0'
zipStr = {}
zipList = []

for line in f.readlines():
    line = line.strip()
    if (not line.startswith(currLett)):
        for zip in zipList:
            print(zip)
            print(', '.join(zipStr[zip]))
            print('====')
            print( '(' )
            for street in zipStr[zip]:
                print( 'way["name" = "', street, '"]({{bbox}});', sep='')
            print(');', "out body;", ">;", "out qt;", sep="\n")
            print('====')

        currLett = line[0]
        zipStr = {}
        zipList = []
    
    toks = line.split(';')
    street = toks[0]
    zips = toks[1].split(',')

    visited = False
    for zip in zips:
        if (zip in zipStr):
            zipStr[zip].append(street)
            visited = True
            break
    
    if not visited:
        zipStr[zips[0]] = [street]
        zipList.append(zips[0])

My output for a given letter and a given zip code now looks like this:

8001 Zürich
Cäcilienstrasse, Caroline-Farner-Weg, Chorgasse
====
(
way["name" = "Cäcilienstrasse"]({{bbox}});
way["name" = "Caroline-Farner-Weg"]({{bbox}});
way["name" = "Chorgasse"]({{bbox}});
);
out body;
>;
out qt;
====

I can send the part between the ==== lines to overpass turbo to see where these are on a map:

Section of a map of the center of Zürich with Cäcilienstrasse, Caroline-Farner-Weg and Chorgasse highlighted in blue
Credit: OpenStreetMap

I quickly realized that this was not necessarily the best approach because a/ zipcode areas are actually quite large b/ stopping at the boundary of zipcodes is actually fairly arbitrary. But, playing with these did bring overpass turbo to my attention, including the fact that it has an API that looked useful: Overpass API. I consequently modified my query to get “streets starting with the same letter within a radius of 500m1 of a starting point”, with the starting point defined as “the first street that I haven’t processed yet”. I actually have two overpass queries now. The first one displays the map:

[out:json];
(
  area[name="Zürich"][place="city"];
  way(area)["name"="Aargauerstrasse"]->.a;
  way(area)(around.a:500)["name" ~ "^A"][highway]({{bbox}});
);
out body;
>;
out skel qt;

The second one tells me exactly which streets I’m visiting that day:

[out:csv("name";false)];
(
	area[name="Zürich"][place="city"];
	way(area)["name"="Aargauerstrasse"]->.a;
	way(area)(around.a:500)["name" ~ "^A"][highway]({{bbox}});
	for (t["name"])
	(
  		make x name=_.val;
  		out; 
	);
);

Ideally I’d be able to get both in one query somehow, and in a way that doesn’t require editing both the name of the street and its first letter in two places; for now, let’s call that good enough. Compared to the zipcode approach, I’ll also have to manually track streets and feed the next one to the query; maybe I’ll do something fancier at some point, but for now, again, let’s start things and see where the pain points are before prematurely optimizing.

There – I am now READY to go exploring the streets of Zürich! I expect the process there to be: for each street, take a picture of the street sign (to have an idea of where pictures are taken!), take a general view picture of the street, try to find a few fun details, go home, process pictures. And then, publish pictures on Wikimedia Commons, on the blog, and on Pixelfed, rinse and repeat. Oh, and update the spreadsheet, too.

Screenshot of a spreadsheet with the lines as "street names" and the columns as "Shot / Processed / Commons / Written blog / Published blog / Pixelfed". The cells are red and green no/yes, where the two first lines are all "yes", the second line has "yes" on "shot" and "processed", and the rest is "no".

Let’s go!

  1. Value decided by taking the first street and see what looks reasonable from there. Very scientific approach. Also, this seems to yield 2-3km paths for photo walks, which is pretty good, actually. ↩︎

“What do I do with that lime?” or “The genesis and state of my cocktail book index”

Two martini glasses with a clear liquid and an olive in each, over a seamless grey/white background

A while ago, I bought an excellent book, called Drinking French, by David Lebovitz. It’s not strictly a cocktail book because there’s lots of stuff in it, but I’ll admit that I’ve only tested the cocktail recipes so far.

I have also, since then, bought another excellent book, called Cocktail Codex, also a staple next to my liquor cabinet.

These two books have a few common issues:

  • their (paper) index does not make it easy to search for a cocktail that have two distinct ingredients (apart from looking at the index and finding the intersection),
  • their index is not complete and, in particular, does not contain “trivial” ingredients such as lemon juice or simple syrup,
  • their index does not necessarily account for substitutions I may feel confident doing,
  • they don’t have a common index and I’d need to have a look at both to make decisions.

So I typically find myself in a situation where I have limes, and no idea what I can make with them, except it’d be nice to have something with gin. Also, I’m not that picky and probably if you give me a recipe with lemons, I’ll put my limes in it instead and call it good enough. So, the problem that I was trying to solve was: “given a set of cocktail ingredients, give me ideas for what I can make with them, allowing for some fuzziness in the exact research”.

With that problem in the back of my mind, roughly at the same time, I read Index, A History of the, by Dennis Duncan (a book about the art of indexing), and I became somewhat fascinated by Wikibase (the Mediawiki-base software backing Wikidata, which handles structured data). Things kind of clicked to “WHAT IF I re-indexed the books in a Wikibase instance, I added some structure to the ingredients for the fuzziness, and I made SPARQL queries to get exactly what I want?”

So I did that – I installed Wikibase, and I started re-indexing. I added some structure to the data by adding “subclasses of” and “instances of” and “can be substituted by” and “such as”, and it was glorious. Then I gave some thought about the exact query I was interested in, and I ended up with something along the lines of “given a list of ingredients, for each of them, get a list of substitutes, and give me a recipe that contains at least of one substitute of each ingredient of the list”, where “substitute” is defined as either the ingredient itself, something that is explicitly defined as a substitute, or something that is (transitively) either a refinement or a larger category of the ingredient. The reasoning there is that, if I input “London dry gin”, I want to get the recipes that have “gin” (without qualifier), but also the ones that have a specific brand of London dry gin.

I bundled a small Mediawiki extension called CocktailSearch to be able to query my database and, for a while, I was happy. Here’s an early version of that interface (I had added the page number in the meantime too!)

Screenshot of a Mediawiki interface showing the CocktailSearch extension, displaying results for a search for lime juice and Cointreau.

And then, doubts crept in. My Wikibase install was run via the Docker images. It worked pretty well, but I was a bit unhappy with running 9 Docker images, including one that kept restarting (I probably could have fixed that one, but eh), on a machine (my home Windows desktop computer) that wasn’t really suited for it. I’m not much of a system administrator and I have 0 confidence in my Docker skills in general: the whole setup was making me a bit nervous. Migrating my cocktail index to a more persistent setup became my new project.

I considered multiple options, including “just moving the Docker images to another machine”. I finally settled on trying to run Wikibase, without the Docker images, on a Raspberry Pi that we have laying around. I actually went pretty far in the installation, and I think it could have worked out. But again, I got really nervous about the durability of the setup – Raspberry Pis are not known for being particularly good at data persistence. On top of that, getting from something that “mostly works” to something that I could plug in and access three minutes later with everything running looked like a goal that I might be able to eventually reach, but software rot was a real concern. I felt stuck.

I talked about that with my husband, who pointed out that my usage of SPARQL was actually fairly limited (it is, in fact, limited to a single large query), that my data was actually very very small (maybe a thousand records), and that I could maybe… not use SPARQL, and then not need the whole Wikibase machinery either. I was not convinced at first, because killing your darlings is hard. I had invested quite a bit of fondness in that architecture, and I did like the idea of running mostly standard software. But it didn’t take that much thinking before I actually got excited about the idea of simplifying the whole project drastically.

So, I exported my data to a JSON file, and I started hacking some import script. I then looked at my imported data and at my SPARQL query, hacked some loops in PHP, and essentially called it a day: my SPARQL query and my PHP queries were returning the same results for my few test queries.

Then, came the question of completing the database – indexing takes time, and my base was (and is still) not complete (and, who knows – maybe I’ll index some more books later!). While I’m able to programmatically read the dumped Wikibase JSON, I’m definitely not able to write it by hand without a lot of tears; but continuing to run Wikibase just as an input interface felt a tad excessive. Hence, I transformed my JSON structures into a flat file format that I could easily write by hand and easily parse. I added a significant amount of validation to avoid typo-duplicates and missing item references, and I re-exported my JSON data into that new format. I double-checked that I wasn’t losing any information (I’m indexing a bit more than I need, technically, because I’m also taking notes on the glass type, for instance), and then I started trying to complete the file with new items.

I honestly thought I wouldn’t last three recipes without slapping some kind of interface/completion on that file format, but it’s going significantly better than I expected. I did modify the file format a bit to make it easier to edit manually, at the cost of reading through the file twice when parsing it (I can live with that; and if I couldn’t, I could optimize there, but why bother :P). It feels like it’s enough: I have a validation script that runs fast enough with good enough error messages that I can input things and correct them more quickly and more pleasantly than I did with the Wikibase interface.

Speaking of interface, I also slapped a small web interface on the script, so that I can search with completion and have a readable output. The search completion was also far less involved than I expected: turns out the <datalist> tag does exactly what I want, assuming I pass a list of ingredients (which I can get as “transitive subclasses and instances of the ingredient item”) to the generating HTML. And there, new interface, new results – with additional data entry done in the meantime too 🙂

Screenshot of a HTML table displaying search results for cocktails with limejuice and Cointreau

So anyway, that’s the genesis of the current version of my cocktail book index, which is now called LimeCockail in reference to my original “now what do I do with these limes”.

It does feel a bit of a convoluted path for something that, at the end of the day, is, like, 500 lines of PHP, give or take, but going through that path was very interesting for a variety of reasons. It did give me some hands-on experience with Wikibase (granted, without the issues that come with “running a public instance” 🙂 ), and the Wikibase RDF structure helped me define my structured data in a way that makes sense to me. I also stretched my (almost nonexistent) sysadmin muscles to try to make all of this work together, and I (re-)learnt a few things about the LAMP stack and ElasticSearch. I also got a bit more experience with SPARQL, and I touched jQuery for the first time in a long time to be able to hack the search components backed by Wikibase data. All in all, this project taught me a lot of things!

Now I just need to finish indexing the Codex… 🙂

It’s Advent of Code again!

Yup, for the 7th year in a row: it’s Advent of Code time!

Advent of Code is an advent calendar of programming puzzles. Every day of December until Christmas, you get a new puzzle and a piece of the yearly story in which you need to help the elves save Christmas because Santa is in trouble! In the previous years, we’ve repaired the snow machine, the clock that guides the sleigh, the printer that prints the nice and naughty list, time itself, we brought Santa back from the edge of the Solar System, and we tried to take some vacation last year but it was complicated. It seems this year we need to fetch the keys to the sleigh that got dropped in the ocean by a clumsy elf…

The format of the puzzle is a problem and an input (there’s a number of different inputs, assigned randomly (as far as I can tell) to all the users); the solution (typically a number or a short character string) is what matters to prove that you solved the problem. This means that you can solve it with any language you see fit… or even no language at all. There’s a guarantee that all problems can be solved within 15 seconds on 10-year-old hardware, but it may require some more significant work to get there.

I love Advent of Code. The puzzles are interesting and the difficulty ramp up is usually great, the story is whimsy, and it’s good fun. There’s a competitive aspect to it: there’s a leaderboard for the first 100 people to solve the puzzle, and there’s a “private leaderboard” feature on the website that allows to compete with friends or colleagues. I found it a great way to stretch my coding muscles and practice another language.

This year I decided to solve it in PHP: I’m still learning the language (which I’m now using in my daily professional life), and if previous years are to be believed, I’ll probably learn more than a few tricks – looking forward to that! I’m publishing my (ugly) solutions on GitHub as I go: Balise42/AoC2021.

The first day is easy… who’s in? 🙂

Time tracking with timewarrior

I’ve been working from home for a bit more than a month – or, as we say around here, “doing home office”, which is apparently a typically German turn of phrase 😉 Since I’m working part-time (60%), and days and hours tend to melt into each other, actually tracking the time that I spend working has proven pretty useful for me to dose the “right” amount of work: make sure I’m working the hours I’m supposed to work, make sure I’m not working significantly more than the hours I’m supposed to work. For those who know me a little, they’ll have an inkling that my issue is more the latter one than the former, with me being much more worried about the former than the latter 😉

I had done that sort of tracking a long while ago with some software called arbtt. It was fairly neat when it came to automating that tracking (and that’s why I’m mentioning it here explicitly): it uses the mouse focus to determine on which window you are working, identifies said windows by their titles, and allows to define rules to classify which belongs to what. I ran that thing for a while when I was working as a freelancer, and that worked pretty well – if you’re not allergic to Haskell. (My window manager is in Haskell too, so I can survive :p )

This time around, I didn’t feel the need to fight with arbtt rule system to fit everything into categories that would be too fine-grained for my liking; after a bit of poking, I found timewarrior. There’s a package on my Ubuntu, so I just installed it, and I started tracking.

In timewarrior, you track by associating tags to intervals of time. For instance, when I start working on documentation, I open a terminal and type

$ timew start work doc

and it starts an interval tagged with work and doc. I have a very coarse set of tags: my current tags are doc (writing documentation), qa (helping our QA department with testing our software), meeting (daily and weekly status meetings, mostly) and social (when I’m socializing with colleagues, not necessarily being productive per se, although such discussions are very often fruitful). To that, I add a generic work tag to these all categories except social, so that I can easily tally my whole work hours. I’m not actively developing these days, but when that comes back, I’ll handle tags for that as well. I also track lunch when I go for my lunch break 😉

Whenever I start a new interval, it automatically closes the previous one – so if I switch from timew start work doc to timew start lunch, the interval lunch starts, and the interval work/doc is closed. If I want to stop the current interval without starting a new one (typically at the end of the day), I just go

$ timew stop

and no interval is running anymore.

To display what’s been logged so far, timew summary is the way to go. I actually experimented with tracking my Sunday yesterday, and if I want to know how long I spent cooking, I can look at my cuisine tag that way:

[isa@wayfarer ~]$ timew summary :yesterday cuisine

Wk  Date       Day Tags       Start      End    Time   Total
W17 2020-04-26 Sun cuisine 11:28:00 11:59:00 0:31:00
                   cuisine 18:04:59 18:28:09 0:23:10
                   cuisine 18:44:23 19:05:10 0:20:47 1:14:57
                                                            
                                                     1:14:57

It gives me all the instances and a sum of the time I spent overall during the day. This is particularly useful for my work usage: I tag everything I do for work with work, and that allows me to keep track of the amount of work I’ve put in the day.

If I forget to start or stop an activity, it’s trivial to do a posteriori if I’m in an “open” interval, slightly more tricky but still feasible if I need to re-insert things in the middle of other things. Generally speaking, I haven’t found something that I wanted to do that I didn’t find how to yet. The interface can be somewhat clunky, but it’s surprisingly input-flexible (the easy example is that I can do “timew start work doc” or “timew work doc start” or even “timew doc start work” – and it’ll start tracking an activity with tags doc and work in both cases).

The documentation is also very good, allowing both discoverability of features and reference. There’s also ways of getting pretty charts, to export data as JSON, and to develop extensions.

Obviously, if you’re looking for something that synchronizes between several computers, or that you can use on your phone, or or or…. this may not be the software for you. (Although running it somewhere on the internet and tracking via SSH would probably be a viable option). Me, I just want to open a term, type timew start mystuff, close my term, and be done with it – and I don’t care about tracking different things on different computers, because the context of what I’m tracking is different anyway. If your needs align with mine, I can only recommend you have a look at timewarrior 🙂

Advent of Code 2019

2019 was the fifth year of Advent of Code – and I consequently spent December waking up at 6AM and spending a lot of brain cycles solving puzzles to bring back Santa from the other side of the solar system, where he was stranded.

Let me quote myself to describe the whole thing to the people who are not familiar with it.  Advent of Code is an advent calendar with puzzles that can mostly be solved by programming: the input is a problem description and a user-specific input (as far as I know, there’s a set of a “few” pre-validated/pre-tested inputs), and you have to compute a number or a short string, and provide that as a result. If you have the correct result, you unlock a star and the second part of the puzzle, which allows to unlock a second star. Over the course of the 25 first days of December, you consequently get to collect 50 stars.

When I wrote my Advent of Code 2018 blog post last year, it was December 26th, and I had solved everything – this year it took me until yesterday (so, December 31th) before I got the 50th star. I don’t know if the problems were harder or if I got worse at solving them (maybe a mix of both?), but I still made it before the end of 2019, so I’ll count that as a win 🙂

This year, I worked in Kotlin, a JVM-based language designed by JetBrains, and that I enjoy quite a lot – it is fully compatible with Java, and allows for a much terser syntax, and requires to do things explicitly when it comes to mutability of variables and collections. I like it. My solution repository is on GitHub – beware, here be dragons… and spoilers!

And, like last year, let me give a few impressions of the different puzzles for this year. I WILL spoil the problems and at least hint at their solutions – if you want to start solving the problems with no preconception at all, you may want to stop reading here 🙂

Continue reading “Advent of Code 2019”

New monitor, new setup!

I just replaced my 24″ monitor with a new shiny 27″ – 3 more inches in the diagonal, but 4 times more pixels – which required a bit of tinkering – so here’s a bit of a write-up, so that a/ I can share what worked for me and b/ I have something to refer to myself whenever I do that again (I’ll probably have to tinker is some similar ways for the laptop…)

General setup

I have a fairly… personal setup – it DOES work for me, but it’s definitely in the “less common” category, which makes searching for information somewhat more challenging.

  • First things first, obviously: I run Linux, specifically right now Ubuntu 19.04 Disco Dingo – that’s probably the most standard element of my setup.
  • I run it with xmonad/xmobar/dmenu as my user interface.
  • My main screen is now a 27″, 3840×2160 (very pixels, wow)
  • I have a second screen, left of my main one, as a secondary screen, which I mostly use for “browsing documentation when I’m doing something on the main screen” or “chat window when I’m playing in full screen on the main screen”. It’s a 19″, 1280×1024. So, yes, that means multiple-DPI setup – I will admit that the thought had not crossed my mind when I bought the new one. Eh.

So, essentially, this looks like this:

Display configuration

I have a fair amount of things running in the browser, so the first thing I experimented with was changing the scale of the pages of what I was browsing. That went okay on the large screen, but then the scale was completely off for my secondary screen – and switching scale levels depending on the screen would have been a major pain. There is some automated and experimental stuff there; since my setup is already atypical, I decided to not dig much more into why it didn’t work. (I tried. Vaguely.)

I ran into a reasonable solution almost by chance (I didn’t know exactly what I was looking for) here: Configuring mixed DPI monitors with xrandr. I’m now scaling the secondary monitor by a factor of 1.5, which makes it still “good enough for my use” when it comes to the look of the screen (it’s wobbly on my terminal. I can live with that.) and which is “compatible enough with my large screen” when it comes to displaying stuff that’s configured for my large screen.

I’ve been running a “screen setup” script for a long while (which I basically run every time I boot my computer – both on the laptop and on the desktop), so it was a matter of editing the xrandr line to the following:

xrandr --output DVI-D-0 --scale 1.5x1.5 --output DP-2 --pos 1920x0 \
    --mode 3840x2160 --primary 

So from there, I know that whatever I do on the large screen is going to be “good enough” on the secondary screen.

Chrome

Chrome has been a bit of a pain. My first attempt was playing with the default scaling of the rendered web pages and fonts, but the tabs and the UI were still (as expected) super small. I finally found the right flag, specifically --force-device-scale-factor=1.5. As far as I can tell, there’s no way to make that configuration persistent at Chrome level (or, at least, I didn’t find it). And since I’m not starting my browser from an icon or a shortcut or anything like that, I couldn’t set it up there either. I ended up creating a google-chrome launch script in my personal bin directory (which was already setup in front of my PATH, thankfully, otherwise I would have required additional yaks) to pass the flag.

Moreover, the flag worked to scale the UI, but it also re-scaled the web page rendering, so I had to roll back my earlier config attempts. But now everything is fine and I can use Chrome without squinting too much, yay.

The “Save” dialog is still tiny, but I really don’t want to try to fix that now, so it’ll wait.

xmonad / xmobar / dmenu / trayer

My top bar with xmobar and the trayer were feeling a bit cramped, and so did my dmenu (the text-based launcher I use to start everything else). Some adjustments were required there:

  • I changed the configuration of the xmobar position in .xmobarrc to read position = Static { xpos = 1920, ypos = 0, width = 3456, height = 30 } ; the xpos parameter is set to 1920 because I don’t want that bar to be present on my secondary screen (and it’s setup to have a width of 1920); the width is 90% of 3840 so that I have 10% of the width for my trayer.
  • I wouldn’t have needed to touch my xmonad config if not for the fact that it’s launching dmenu, and that dmenu’s config is in the command line; I just modified the font of dmenu so that I have ((modMask, xK_p), spawn "dmenu_run -fn xft:terminus:style=medium:pixelsize=22") to start dmenu on Mod-P.
  • Finally, I only changed the height of the trayer (since the width is expressed as a percentage of the total width) so that it now reads trayer --edge top --align right --SetDockType true --SetPartialStrut true --expand true --width 10 --transparent true --tint 0x191970 --height 30 --monitor 1 &. This part is in my “setup screen” script, so the modification here was minor.

gnome-terminal

I use gnome-terminal as my standard terminal: it’s the only thing I ever managed to configure exactly as I wanted it (set of colors, unicode handling, non-blinking cursor, and that sort of things.)

The font was on the small side on the highres display, so I switched to Terminus Regular size 22. I’m not convinced yet by that choice, because it feels bolder than I think it should be, so I may have to play with alternate choices at some point or another. For now, it’s good enough. And I don’t care about the UI scaling in general because I don’t use “anything else than writing on the terminal” often enough for it to be a problem.

Slack

I just zoomed to 150% in the default preferences in Accessibility. The menus and whatnot are still tiny, but I actually don’t care (because I don’t use them much). Good enough for now.

Darktable

Darktable the software I use to do most of my photo post-processing. The picture area is much nicer on the new screen (ahem. It may also have something to do with “the picture area is much nicer on a clean screen.), but the interface was also very tiny. Two things there:

  • in .config/darktable/darktablerc, set screen_dpi_overwrite=150 – I didn’t feel the need to experiment more with other values, this works for me
  • in the UI settings (available from the interface), set the “width of the side panels in pixels” to 400.

It is necessary to restart Darktable after this modification.

GIMP

Since I also started to learn how to use GIMP, it did cross my mind to set it up during my initial setup. Two things:

  • I defined the icon size to “Large” in Preferences > Interface > Icon Theme
  • I also defined the font name to “sans 16” in my theme file, /usr/share/gimp/2.0/themes/gtkrc (defined in Preferences > Interface > Theme).

And this can be reloaded without restarting Gimp 🙂

IntelliJ / CLion

I’m using IntelliJ at work, and the rest of the JetBrains IDEs at home. These days, I’m using CLion to develop on Marzipan (my fractal generator). IntelliJ scales its interface depending on the UI font size; so in Settings > Appearance & Behavior > Appearance, I modified the custom font for a size of 20.

This doesn’t modify the editor font size, though, which needs to be defined in Settings > Editor > Font.

Also, I know have a stronger incentive to continue working on my fractal generator: now that I have a higher res screen, I’m tempted to generate high res images, so I need to optimize that 😉 And also probably to decouple the size of the image from the size of my UI 😛

World of Warcraft

I’ll admit, WoW is one of the first things I tested after plugging in everything and checking that basic function was there. I’m running WoW on WINE – and this was actually the least painful experience: it started without problem, the UI scaled properly immediately, and everything was just as I left it. The only difference is that the cursor is smaller (and that I probably need to modify my mouse sensitivity). But all in all, flawless. And it still runs 100fps, which is cool. (I did feel the need to triple check that I was indeed running in that large resolution. It seems I am.)

Slay the Spire

Other game I play a lot, Slay the Spire – there, I had to adjust resolution manually, but once that was done, nothing to see here, move along.

Conclusion

This may seem like quite a lot of work, and some snark along the lines of “if you ran Windows/MacOS/GNOME/KDE you wouldn’t have to configure things in such a gazillion places” may be warranted – but to me the “having things exactly as I want them” is definitely worth a bit of extra work – as well as knowing that once the configuration is stable, it doesn’t break at every update 😉

I’ll probably find a couple more things to fix in the near future, and I’ll update this post with my findings.

Marzipan update – now with context menu!

It may seem trivial, but I unlocked an achievement on Marzipan: I added a menu. I’ve been wanting to have a few “quality of life” improvements for a while now, but so far I had been hiding under the duvet of “I really don’t want to touch the UI/Qt code more than I strictly have to”.

My experience with graphical toolkits in general has never been great. It’s really out of my comfort zone; I tend to find that the tutorials on the Internet don’t have anything between an equivalent of “Hello, World!” and an equivalent of “here’s some advanced quantum mechanics” (I do suck at physics in general as well); I kind of have the impression that my use cases are dead simple and should just Be Available As Is and that For Sure I Don’t Need To Read All That Documentation. (Yeah, yeah, I may be somewhat guilty here.) And I get upset and impatient, and generally speaking it’s not a good experience – neither for myself nor for anyone else in the room. (My apologies to my husband!)

But when you’re the only coder and the only user of a project, at some point biting the bullet gets inevitable. Consequently, in the last pull request, I did a fair amount of refactoring. When I started my coding session, everything was contained in a QWindow, in which I was painting an image directly on the QBackingStore. I then read a bunch of stuff about menus, which made me update my QWindow to a QMainWindow – for which the QBackingStore seems less trivially accessible, so I modified that. But then, the refresh was only working when resizing the window, which kind of sucked (and I’m still not entirely sure why). So I put a QWidget inside my QMainWindow as a main widget, and that allowed me to have both the refresh and the menu – yay! I needed to tinker a bit more to get back the keyboard control (move them from the QWidget to the QMainWindow), and now it’s all nice and shiny.

The undo/redo function itself is basically storing the fractal parameters in a couple of stacks and re-computing on undo/redo – nothing fancy (and my memory management is utter shit – read “nonexistent”, I really need to fix that – and I don’t handle storing the orbits properly yet, but one thing at a time.)

As a result: I do have at least half-functional Undo/Redo, and more importantly, I have a reasonable base for future UI/QoL development: I hope that the major hurdle of figuring out how things might fit together is behind me, and I’m a bit less scared of it.

I can’t say I’m happy with that session, because I still have the impression that I tried to put stuff together while having no idea what I’m doing, and while having the impression that I’m not actually learning anything in the process, but this may actually be better than I think. We’ll see 🙂